Globally, the availability of fresh water is limited, while consumption increases dramatically. The Colorado River in North America, the Nile in Egypt, the Yellow River in China and the Indus in Pakistan during the dry season, do not reach the sea anymore because massive water is pumped out. Lake Chad in Africa has shrunk to 5% of its size. The Lake Chapala in Mexico lost 80% of its water supply. Clean, fresh water is an increasingly scarce commodity in the world for people and nature.
Direct and indirect water consumption
 We use water for drinking, cooking and washing. The production of everyday consumer goods such as food, paper, cotton, etc., requires even much more water.
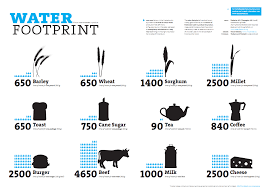
The water footprint is a measure of the water use by a product, measured over the entire production.
The water footprint of a consumer, a producer or group, is the total volume of fresh water that is used to make the goods and services that are consumed by him or by production is consumed.
Many (Western) countries have their water use externalised by importing water-intensive goods. This charges the fresh water resources in the exporting regions.
In function of a sustainable business and lifestyle is therefore an in 2003 standardized water footprint, as developed by the Water Footprint Network important.
The consumed fresh water is divided in three types:
Green water:
rainwater stored in the soil, that the plant is using during the growth, and vaporizes it.
Blue water:
is extracted for irrigation from surface and ground water, and then evaporated.
Grey water:
is the additional water that is necessary in order to dilute polluted water so that the water quality comes within the required standards.
The water exploitation index (WEI) of a country is the ratio between the total annual take on fresh water and the average fresh water supply in the long term.
The alarm threshold is 20%. The indicator also calculates cooling water (for nuclear power stations) along.
At world level agriculture uses today 70% of the available water.
Not only the consumption per capita, also the number of heads is rising sharply.
Water Footprint in l (in Belgium)
apple (150 g) 40,0 l
Coke (33 cl) 208,0 l
1 slice wheat bread, 32 g 44,0 l
300 g of vegetables 60,0 to 100 l
1 slice of cheese 120,0 l
200 g beef 3.960,0 l
200 g poultry 624,0 l
200 g potatoes 34,0 l
lump of cane sugar 4 g 8,0 l
lump sugar 4 g 4,0 l
1 l milk 1.000,0 l
1 egg 200,0 l
cup of tea 30,0 l
glass beer 75,0 l
1 glass of wine 120,0 l
1kg corn 900,0 l
1 kg of wheat 1.300,0 l
1kg pork 4.800,0 l
1 kg of soybeans 1.800,0 l
A cotton T - shirt has 2,700 liters of water absorbed as it is in the shop.
It is estimated that an average of 11,000 liters of water is needed to produce one kilogram of cotton.
A cup of coffee consumes 176 l of water.
An orange had about 70 l of water.
An average meat meal which does not take into account seasonal and organic products has quickly established a water footprint between 2,500 and 3,000 liters.
A meat poor meal with seasonal vegetables has a water footprint of about 1,200-1,500 liters.
We use 2.700 m3/yr per Belgian, or 7,400 liters, so about 90 bathtubs, per person per day. That is double the global average, and more than our neighbors (Netherlands 2,300 m3/pp./year, United Kingdom 1,700 m3/pp./year).
The Belgian water footprint is for 75% external.
Our agricultural products use 93.6%. Of the 7,406 l of the Belgian daily average is 6,931 l related to the consumption of vegetable or animal products. Water consumption linked to industrial products is 258 l (3.5%). Straight from the tap, we use an average of 218 liters per capita per day (including public services).
Over 50% of our external water footprint of crops comes from wheat, cotton, soybeans and coffee, partly from tropical or subtropical countries.
Internally play especially wheat, sugar beet, barley and corn along.
The largest product water footprint is for milk, followed by beef, pork and poultry of which 54% is imported.
Here you can go count yourself:
http://calculator.watervoetafdruk.be/